How to visualize soccer markers
This package contains nodes that convert ROS2 Soccer Interfaces msgs to RViz Markers that allow visualization of soccer-related topics. Instructions here run each node in isolation, to run all nodes from a launch file, see Launch all Conversion Nodes.
Publish test data
In a new terminal, start by simulating incoming vision data:
ros2 topic pub vision/ball soccer_object_msgs/msg/Ball '{header: {frame_id: test_frame}, center: {x: 2.0, y: 1.0, z: 0.0}}'
ros2 topic pub vision/goalposts soccer_object_msgs/msg/GoalpostArray "{posts: [{header: {frame_id: test_frame}, point: {x: 2.0, y: 2.0, z: 0.0}}]}"
ros2 topic pub vision/field_lines soccer_object_msgs/msg/FieldLineArray "{lines: [{header: {frame_id: test_frame}, start: {x: 3.0, y: 2.0, z: 0.0}, end: {x: 3.0, y: 1.0, z: 0.0}}]}"
ros2 topic pub vision/flags soccer_object_msgs/msg/FlagArray "{flags: [{header: {frame_id: test_frame}, base: {x: 1.0, y: 2.0, z: 0.0}}]}"
ros2 topic pub vision/robots soccer_object_msgs/msg/RobotArray "{robots: [{header: {frame_id: test_frame}, head: {x: 3.0, y: -1.0, z: 0.50}}]}"
Note
In this tutorial, we’re publishing data in the test_frame frame. On a real robot, this frame would most likely be
a frame such as camera, or wherever the vision data is relative to.
Run conversion node
In a new terminal, run the corresponding node to convert vision data to visualization markers:
ros2 run soccer_marker_generation ball_to_marker
ros2 run soccer_marker_generation goalpost_array_to_marker_array
ros2 run soccer_marker_generation field_line_array_to_marker_array
ros2 run soccer_marker_generation flag_array_to_marker_array
ros2 run soccer_marker_generation robot_array_to_marker_array
Tip
To run all nodes from a launch file, see Launch all Conversion Nodes.
Open RViz
In a new terminal, open RViz:
rviz2
Change Fixed Frame
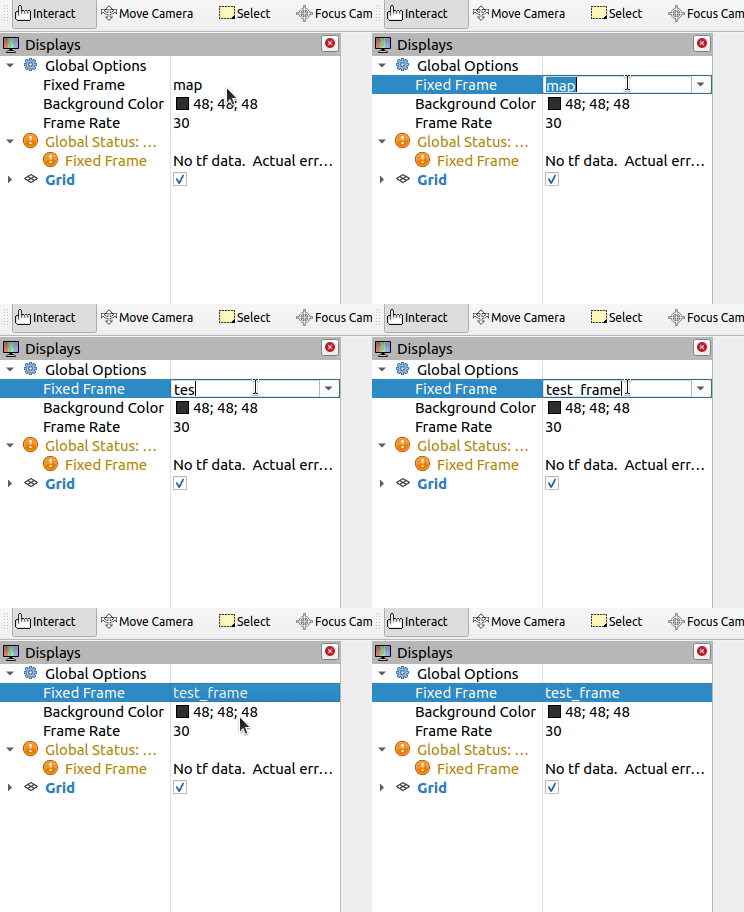
Set Global Options > Fixed Frame to test_frame.
Note
Ideally, fixed frame is set to map, or world. In this tutorial, we don’t have a transform from test_frame to any of those
frames. By setting fixed frame to test_frame, we don’t have to publish any transforms to visualize the data.
Add Marker to Display
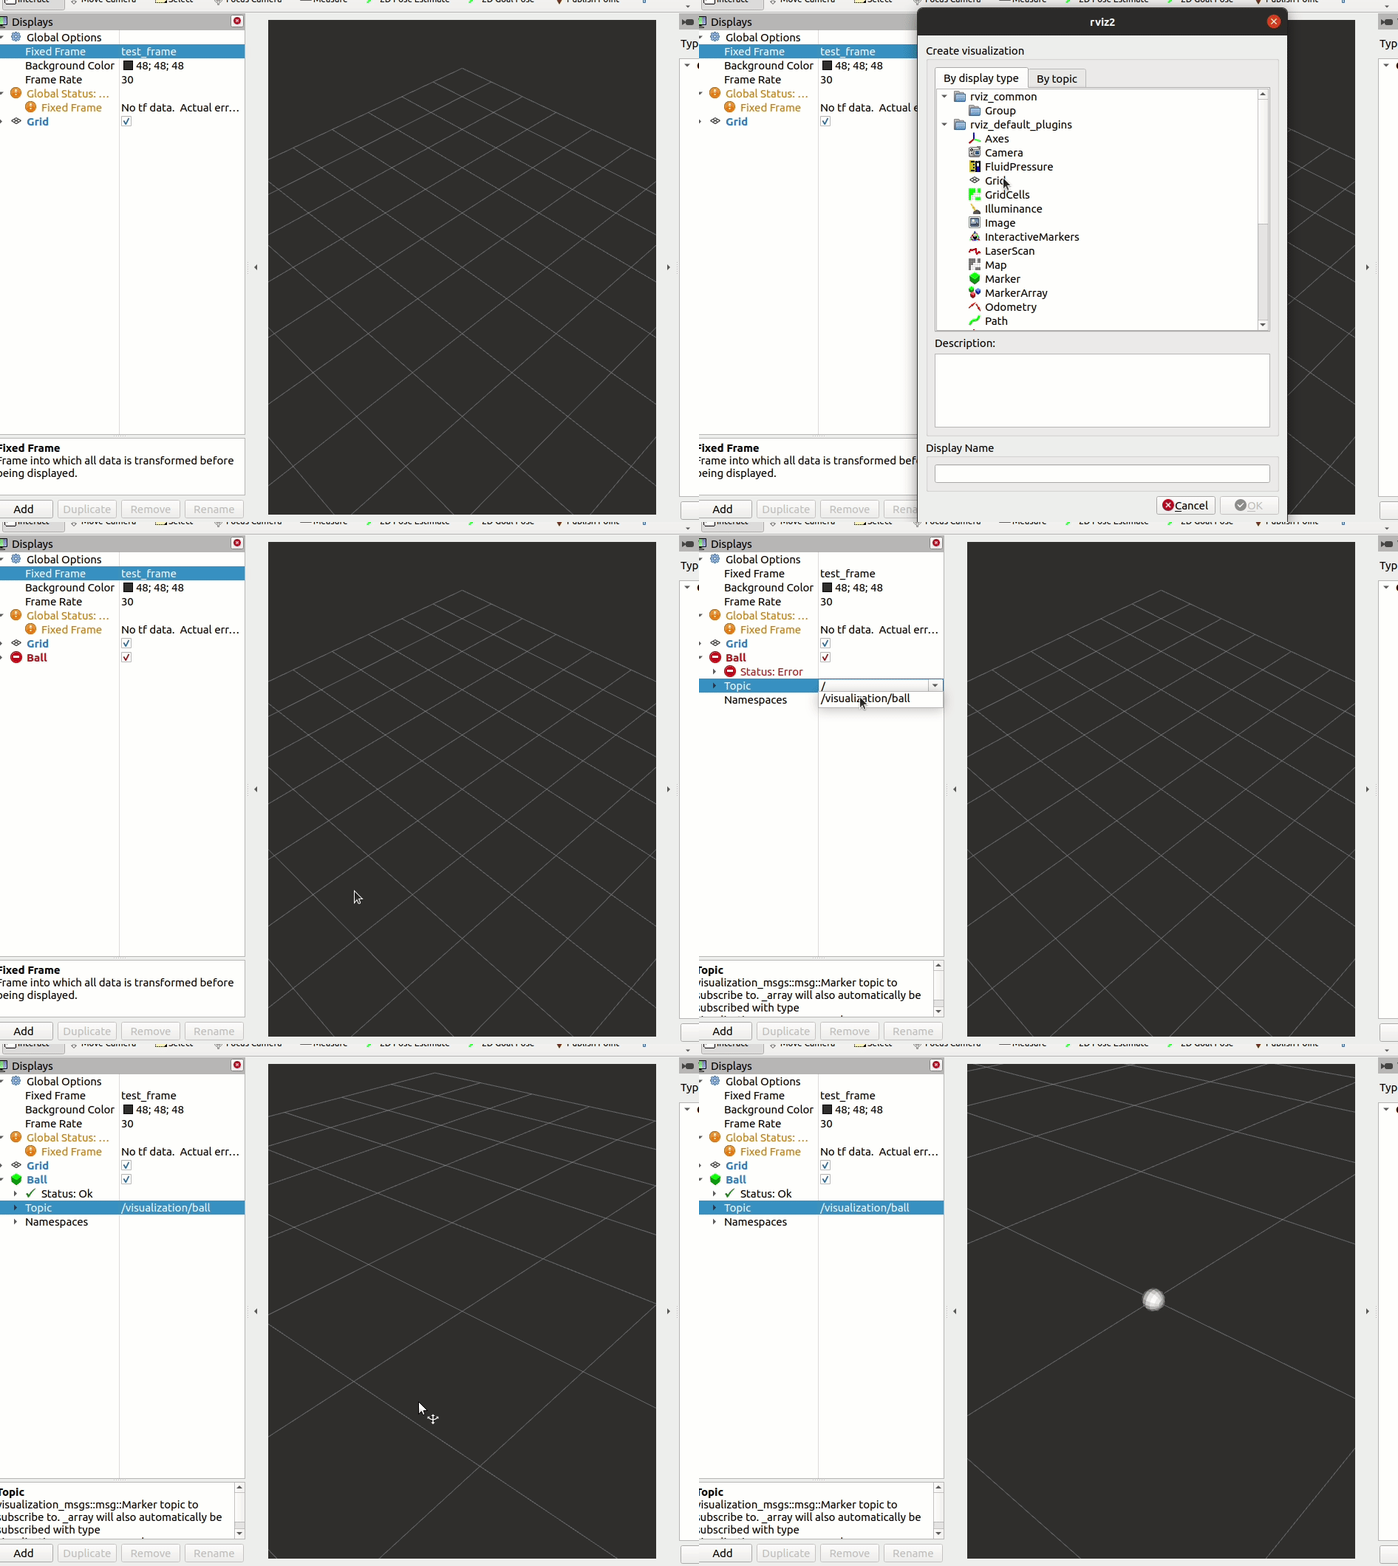
In Rviz, add a new Marker display, and set topic to visualization/ball.
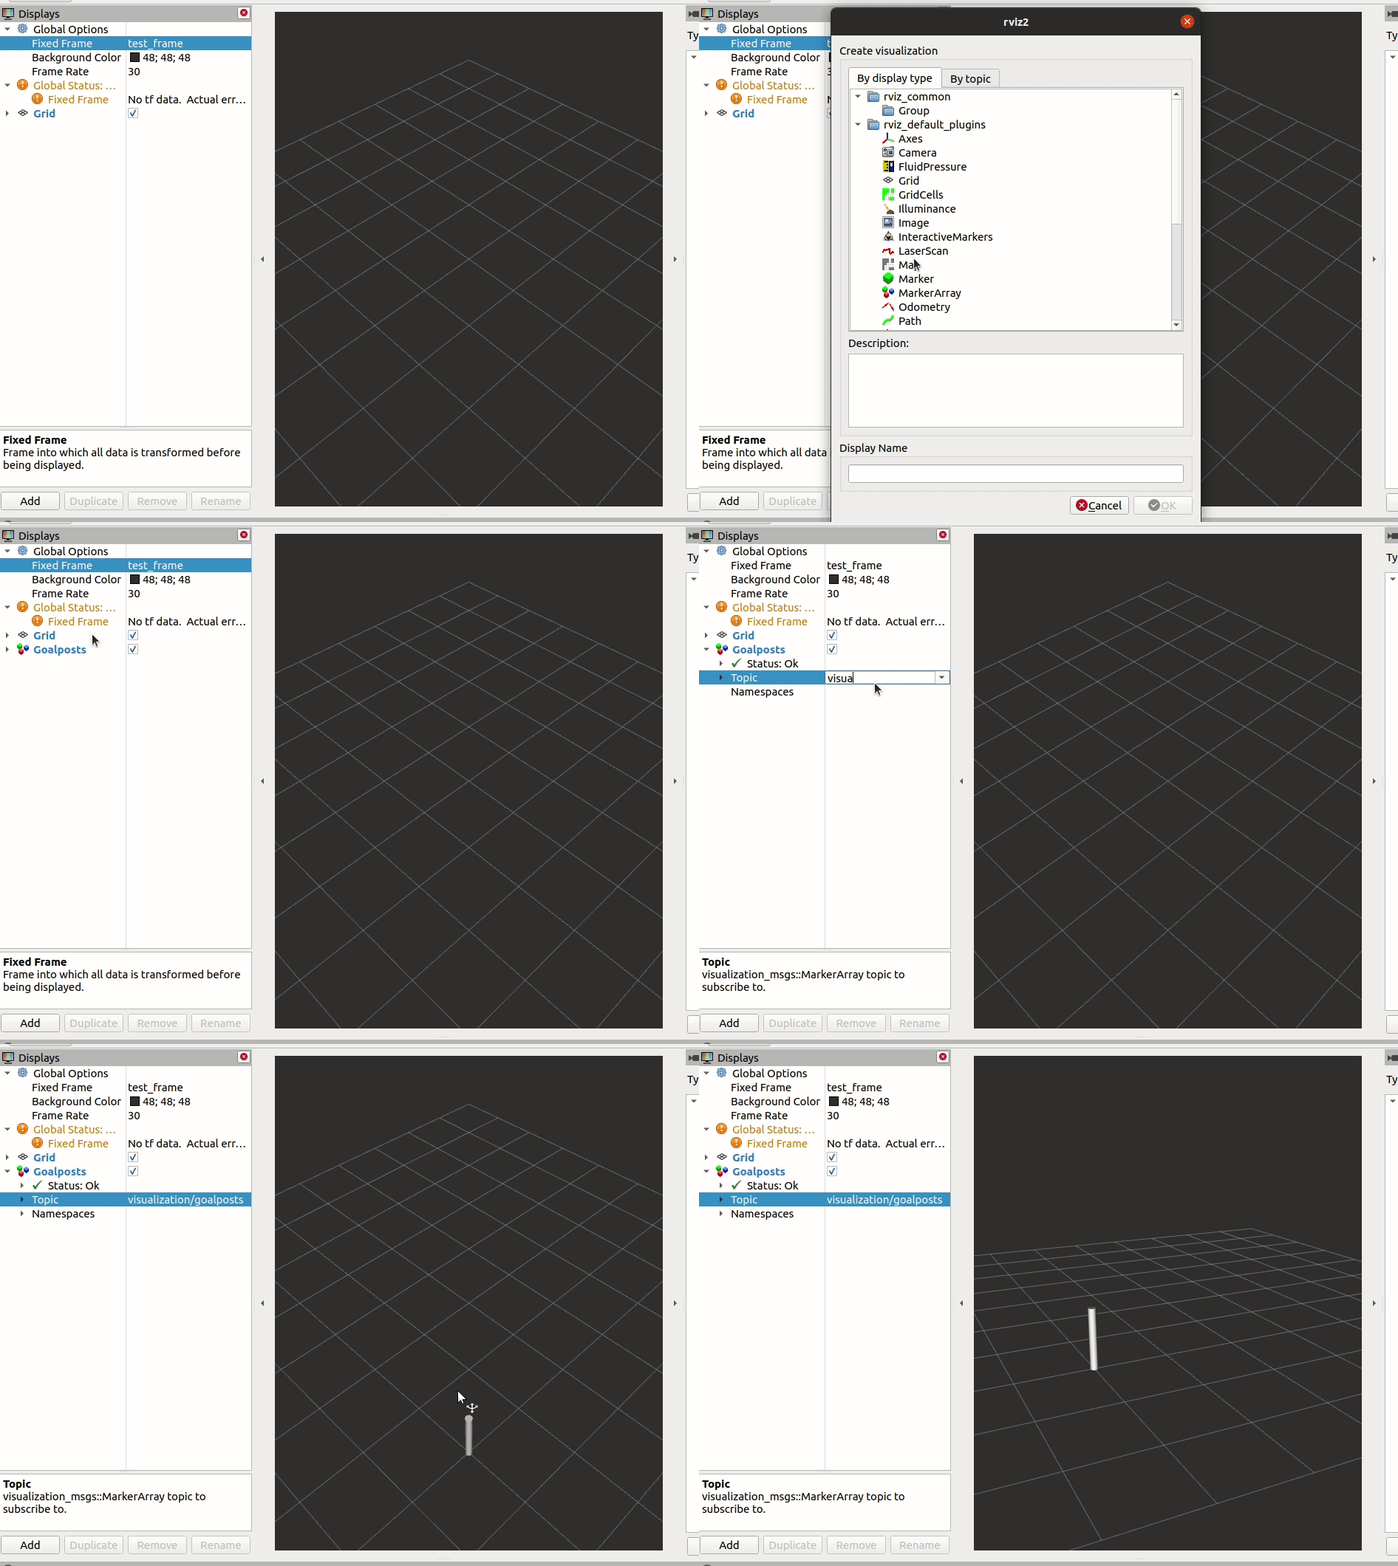
In Rviz, add a new MarkerArray display, and set topic to visualization/goalposts.
In Rviz, add a new MarkerArray display, and set topic to visualization/field_lines.
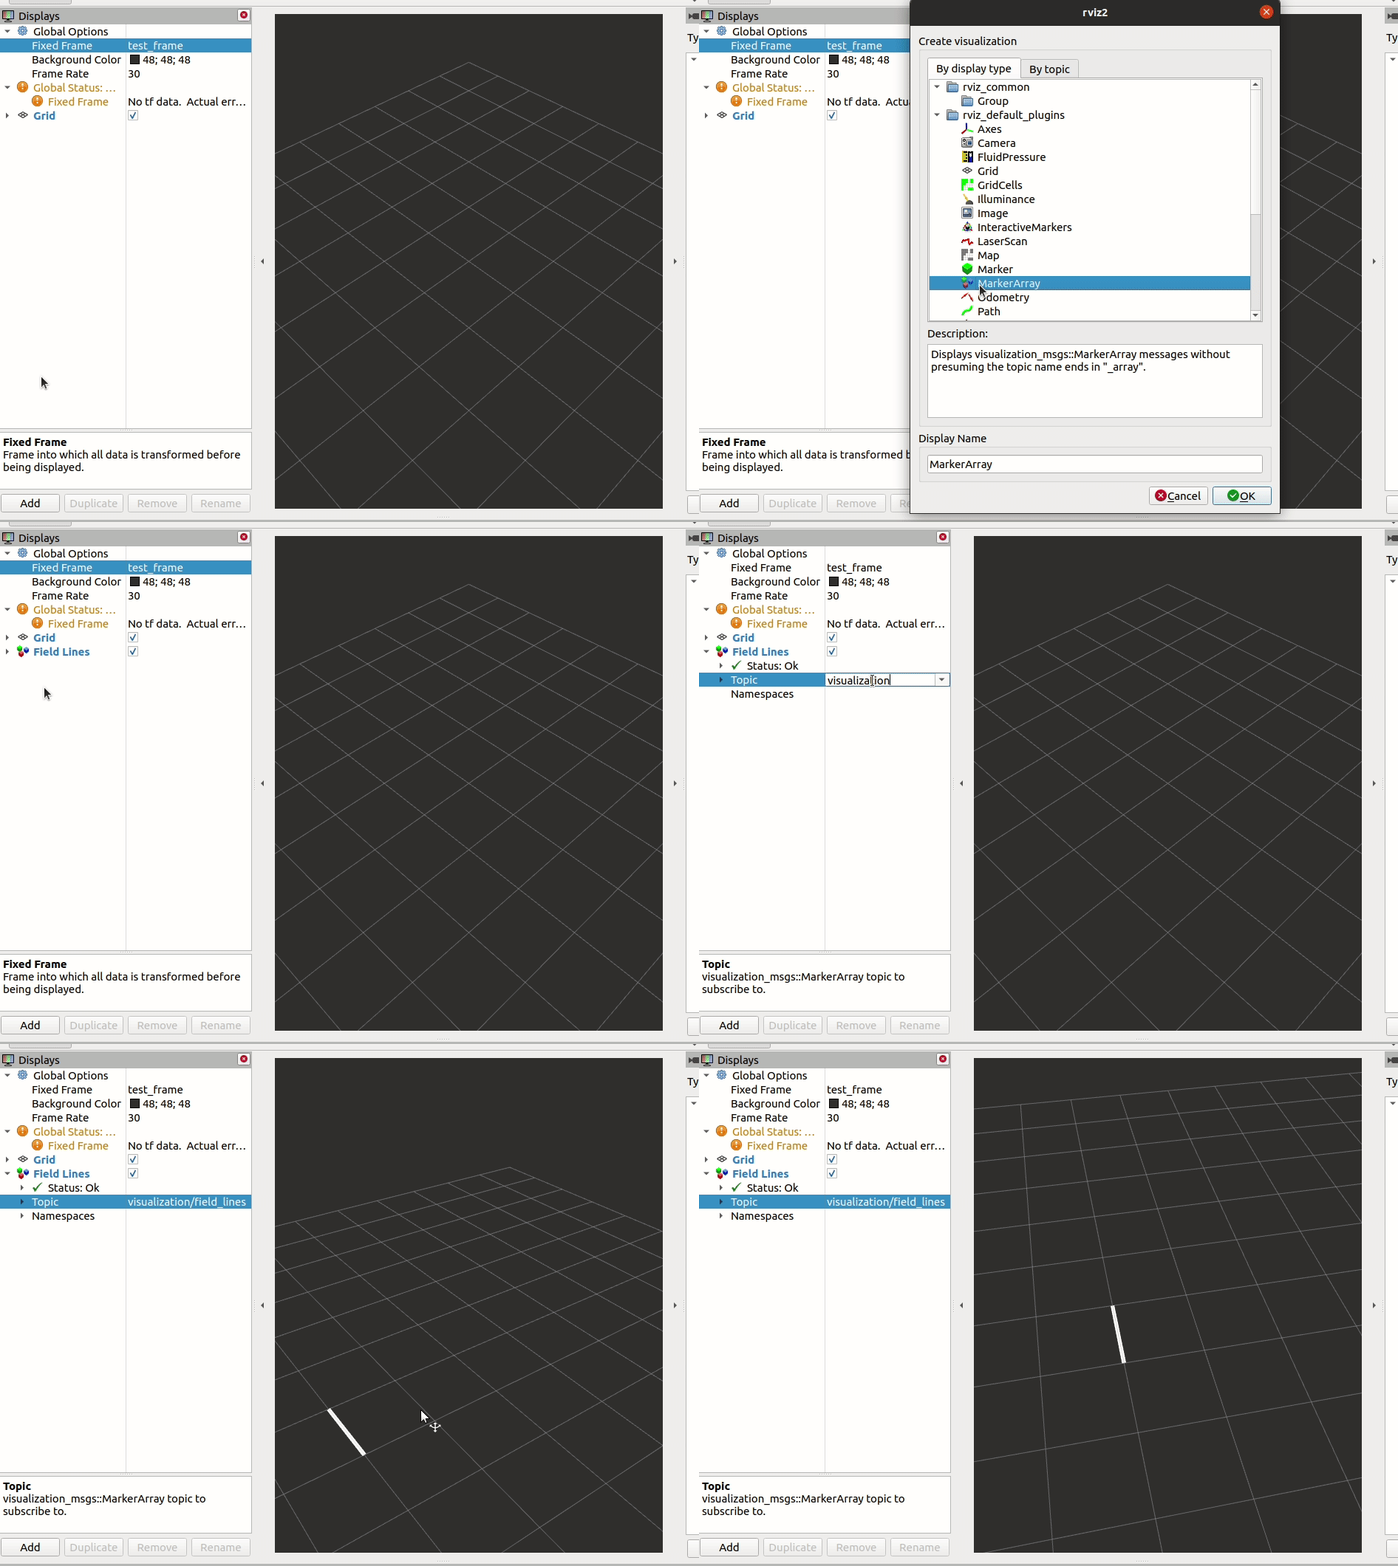
In Rviz, add a new MarkerArray display, and set topic to visualization/flags.
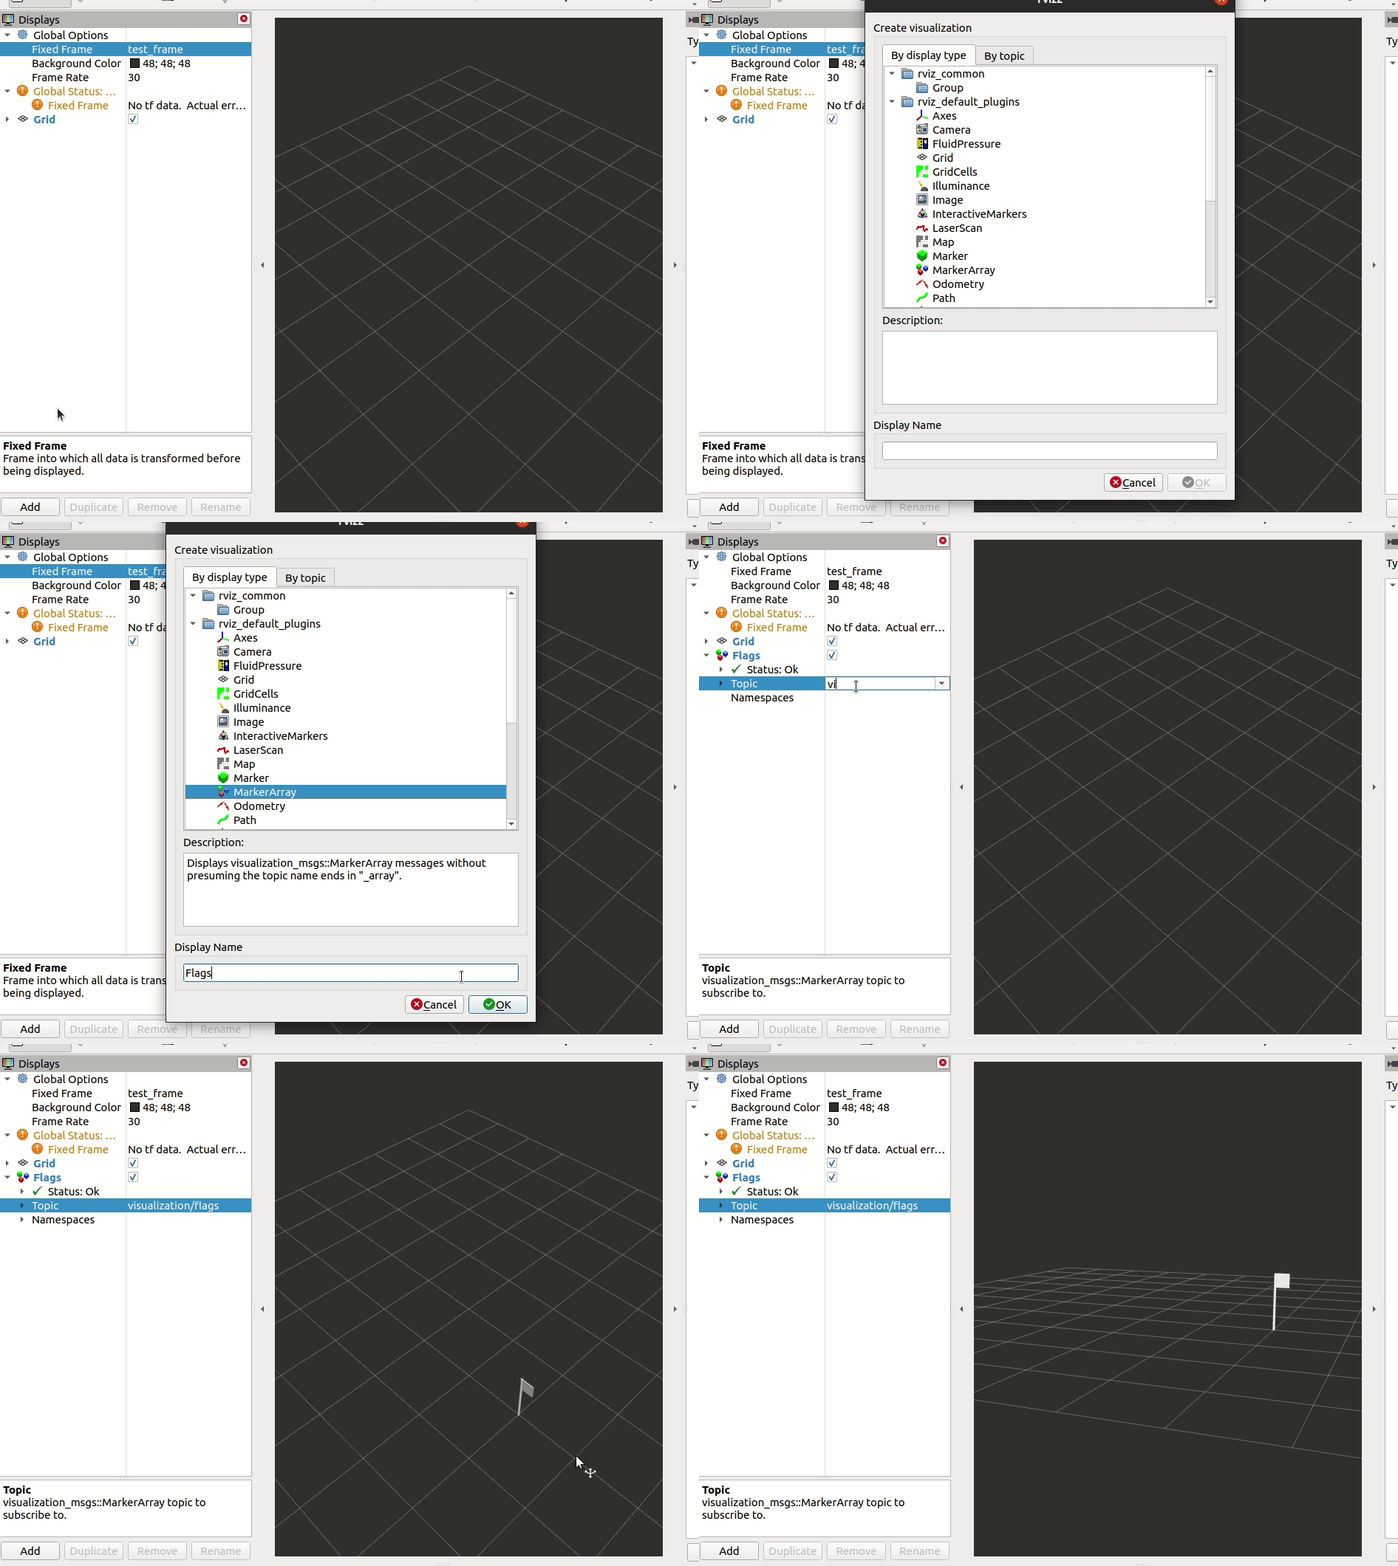
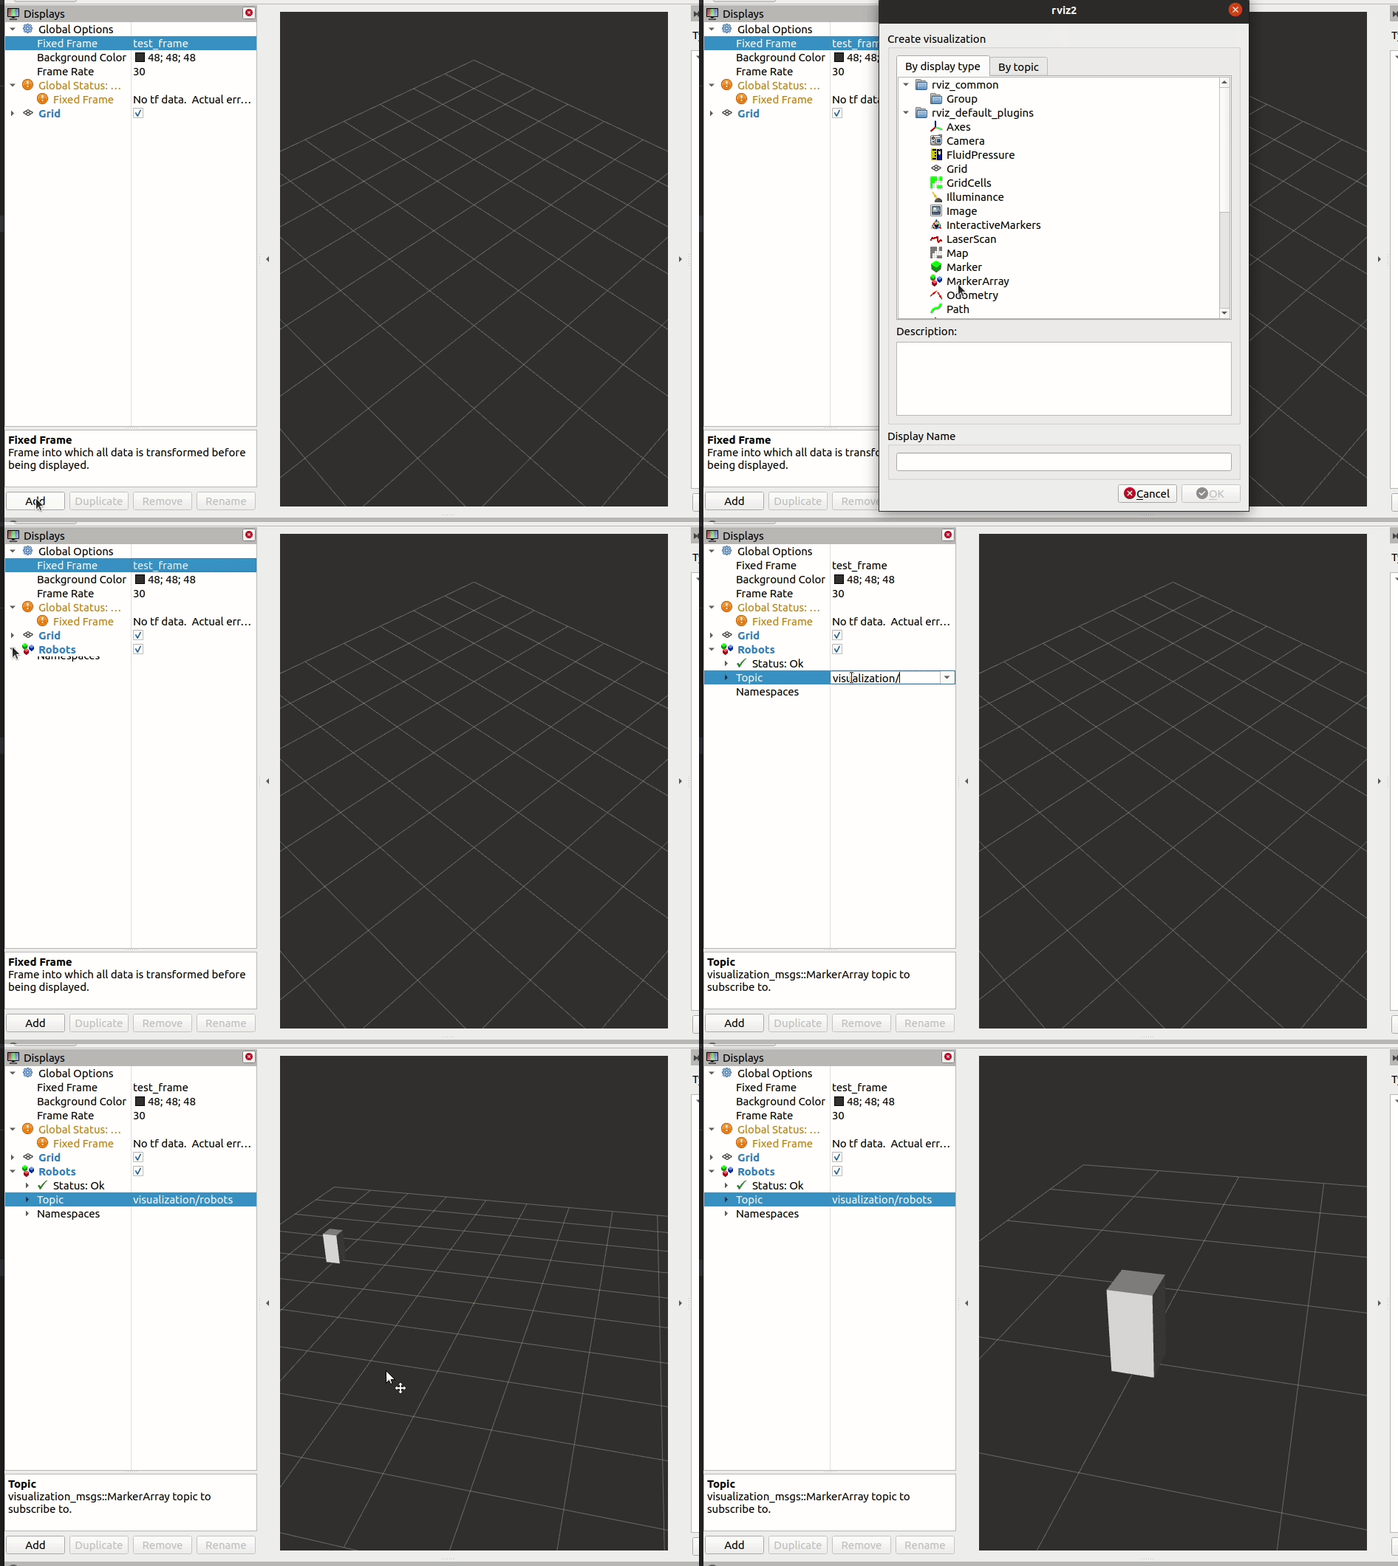
In Rviz, add a new MarkerArray display, and set topic to visualization/robots.
